

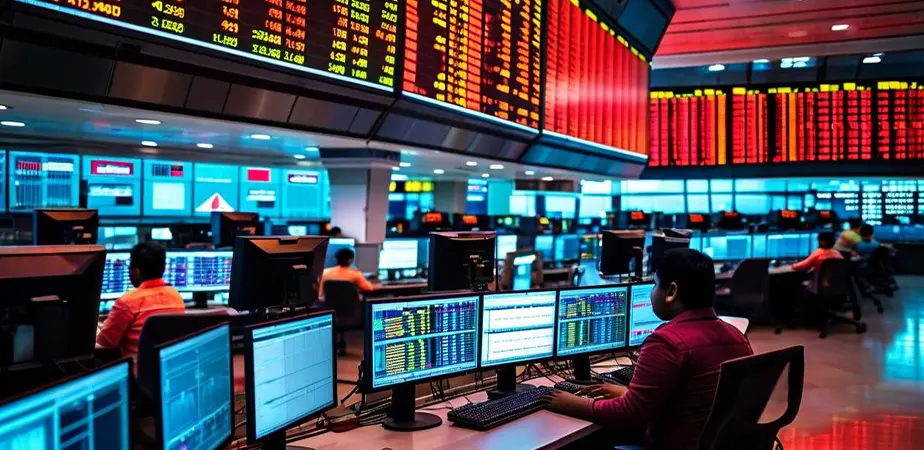
On January 25, 2023, a short-seller report dropped after US market hours, targeting one of India’s largest conglomerates. By the time NSE opened the next morning, the news had spread to every corner of Indian financial media. Within minutes of the 9:15 open, multiple stocks in the group hit their lower circuit limits, trades halted, prices frozen, order books locked. For developers whose apps were displaying live portfolio values to thousands of retail investors, the experience was disorienting: the data feed went completely quiet not because of a network failure, but because the market itself had activated its emergency stops.
That event is a good introduction to what makes NSE and BSE data technically interesting to work with. India is simultaneously the world’s fastest-growing retail equity market (demat accounts grew from 35 million in 2020 to over 175 million by 2025) and one of the most structurally complex from a data engineering perspective. Circuit halts. A pre-open call auction. A half-hour timezone offset. Two major exchanges listing many of the same stocks. Market-wide index circuit breakers that can pause all trading simultaneously across NSE and BSE.
This guide walks you through an Indian trading day from a developer’s perspective, what the data looks like at each phase, what can go wrong if you don’t account for it, and how to build a pipeline using Infoway API that handles all of it cleanly.
The India Trading Day: A Map for Developers
Before writing a single line of code, it helps to have a mental model of what NSE’s trading day actually looks like:
06:00 IST  Pre-market sentiment (global cues, ADR prices, SGX Nifty futures)
09:00 IST  Pre-open session begins — orders accepted, none executed
09:08 IST  Order entry closes; equilibrium price calculation runs
09:15 IST  Continuous trading begins — first trades execute
         ↕  (at any point a stock can hit its circuit limit and halt for 15+ minutes)
15:20 IST  Final pre-close calculation period begins
15:30 IST  Continuous trading ends
15:40 IST  Closing session (closing price determined via weighted average)
16:00 IST  Market closes completely
[on Diwali evening: Muhurat Trading, ~1 hour, time varies by year]All times are IST (India Standard Time), which is UTC+5:30, not UTC+5, not UTC+6. That extra 30 minutes is the first thing that breaks a naive implementation. Every timezone conversion, every session check, every scheduled job targeting the Indian market open needs to account for it:
from datetime import datetime, timezone, timedelta

IST = timezone(timedelta(hours=5, minutes=30))   # ← the 30 minutes matter

def ist_now() -> datetime:
    return datetime.now(IST)

def session_phase() -> str:
    now = ist_now()
    if now.weekday() >= 5:
        return "weekend"
    t = now.time()
    def hm(s): return datetime.strptime(s, "%H:%M").time()
    if t < hm("09:00"):   return "pre_market"
    if t < hm("09:15"):   return "pre_open"
    if t < hm("15:30"):   return "open"
    if t < hm("16:00"):   return "closing"
return "after_hours"With that foundation in place, let’s follow the data through the day.
Phase 1: Pre-Open (9:00–9:15 IST): Watching Prices Converge Before the Bell
The pre-open session is something most markets don’t have, and it produces data behavior that confuses developers the first time they encounter it.
From 9:00 to 9:08 IST, market participants submit limit orders at whatever prices they think are fair. The exchange collects all of these bids and asks but executes none of them. At 9:08, order entry closes. The exchange then runs an equilibrium pricing algorithm: it finds the single price that maximizes the number of shares that can trade across all pending orders. That price becomes the opening price. At 9:15:00, every eligible order at that price executes simultaneously, and continuous two-sided trading begins.
From a data feed perspective, the pre-open window is a useful signal. You can poll the trade endpoint during this window and watch the indicative equilibrium price evolve as orders come in. A stock gapping up sharply relative to yesterday’s close, with heavy pre-open order flow on the buy side, often continues upward at the open. A stock where the pre-open price is drifting toward the lower circuit might be about to get locked the moment trading starts.
import requests
import time
from datetime import datetime, timezone, timedelta

IST      = timezone(timedelta(hours=5, minutes=30))
ENDPOINT = "https://data.infoway.io/india/batch_trade/{codes}"
HEADERS  = {
    "User-Agent": "Mozilla/5.0",
    "Accept":     "application/json",
    "apiKey":     "YOUR_API_KEY_HERE"
}

def get_snapshot(symbols: list[str]) -> dict[str, dict]:
    codes = ",".join(symbols)
    r = requests.get(ENDPOINT.format(codes=codes), headers=HEADERS)
    r.raise_for_status()
    return {item["s"]: item for item in r.json().get("data", [])}


def watch_pre_open(symbols: list[str], prev_closes: dict[str, float]) -> None:
    """Poll every 60 seconds during pre-open and print indicative opening prices."""
    print(f"{'Symbol':<18} {'Prev Close':>12} {'Pre-Open':>12} {'Gap %':>8}")
    print("-" * 58)

    while session_phase() == "pre_open":
        snap = get_snapshot(symbols)
        for sym, prev in prev_closes.items():
            tick = snap.get(sym)
            if not tick:
                continue
            price = float(tick["p"])
            gap   = (price - prev) / prev * 100
            flag  = " ⚠ UC" if gap > 18 else (" ⚠ LC" if gap < -18 else "")
            print(f"{sym:<18} {prev:>12.2f} {price:>12.2f} {gap:>+8.2f}%{flag}")
        print()
        time.sleep(60)

print(f"Pre-open ended at {ist_now().strftime('%H:%M:%S IST')} — continuous trading begins")The ⚠ UC / ⚠ LC flags mark stocks within striking distance of their upper or lower circuit limit (using 18% as a proxy for the 20% filter band, tighten or loosen based on each stock’s actual assigned circuit band). When a stock is already near its limit during pre-open, there is a real chance it will hit the circuit within the first few minutes of continuous trading.
Phase 2: The Opening Snapshot (9:15 IST): Capturing Where the Day Starts
At 9:15:00, the call auction clears and the first real trades print. This snapshot is the foundation for all intraday analysis: gaps, relative performance, sector rotation, and circuit proximity.
With Infoway API’s batch trade endpoint, you can pull opening prices for up to 100 symbols in a single request. Here’s a script that captures the Nifty 50 heavyweights the moment trading begins:
import requests
import json
import time
from datetime import datetime, timezone, timedelta

IST      = timezone(timedelta(hours=5, minutes=30))
ENDPOINT = "https://data.infoway.io/india/v2/batch_kline"
HEADERS  = {
    "User-Agent":   "Mozilla/5.0",
    "Accept":       "application/json",
    "Content-Type": "application/json",
    "apiKey":       "YOUR_API_KEY_HERE"
}

NIFTY50_SAMPLE = [
    "RELIANCE.IN", "TCS.IN", "HDFCBANK.IN", "INFY.IN", "ICICIBANK.IN",
    "BHARTIARTL.IN", "ITC.IN", "AXISBANK.IN", "LT.IN", "SUNPHARMA.IN",
    "WIPRO.IN", "TATAMOTORS.IN", "MARUTI.IN", "NTPC.IN", "POWERGRID.IN",
]


def get_opening_candle(symbols: list[str]) -> dict[str, dict]:
    """Pull the most recent 1-minute candle for each symbol (the opening bar)."""
    payload = {
        "klineType": 1,
        "klineNum":  2,
        "codes":     ",".join(symbols)
    }
    r = requests.post(ENDPOINT, headers=HEADERS, data=json.dumps(payload))
    r.raise_for_status()
    result = {}
    for item in r.json().get("data", []):
        bars = item.get("respList", [])
        if bars:
            result[item["s"]] = bars[0]   # most recent bar
    return result


def wait_for_open() -> None:
    while session_phase() != "open":
        remaining = 0
        now = ist_now()
        if now.weekday() < 5:
            from datetime import datetime as dt
            open_today = dt(now.year, now.month, now.day, 9, 15, tzinfo=IST)
            diff = (open_today - now).total_seconds()
            if diff > 0:
                print(f"  Market opens in {int(diff//60)}m {int(diff%60)}s...")
        time.sleep(15)


wait_for_open()
time.sleep(30)   # let the first minute bar close

opening = get_opening_candle(NIFTY50_SAMPLE)

print(f"\nOpening snapshot — {ist_now().strftime('%H:%M IST')}\n")
print(f"{'Symbol':<18} {'Open':>10} {'High':>10} {'Low':>10} {'Vol':>12}")
print("-" * 65)
for sym, bar in sorted(opening.items()):
print(f"{sym:<18} {bar['o']:>10} {bar['h']:>10} {bar['l']:>10} {bar['v']:>12}")This gives you the first 1-minute bar for each stock: the range, the opening print, and critically, the volume which tells you whether the pre-open order flow translated into real participation, or whether the gap open attracted no follow-through.
Phase 3: Live Session Monitoring: Real-Time Ticks via WebSocket
For the main continuous session (9:15–15:30 IST), polling REST endpoints adds latency and burns your rate limit. The right tool is WebSocket streaming, the server pushes each trade as it executes.
WebSocket endpoint for India equities:
wss://data.infoway.io/ws?business=india&apikey=YOUR_API_KEY_HEREThe connection stays alive for the full session. You subscribe to trades, depth, and/or candles per symbol, and you receive each update as the market generates it. Heartbeats are required every 30 seconds or the server drops the connection.
import asyncio
import json
import uuid
import logging
from typing import Optional
import websockets
from websockets.exceptions import ConnectionClosed

logging.basicConfig(level=logging.INFO,
                    format="%(asctime)s %(levelname)s %(message)s")
logger = logging.getLogger("nse-ws")

WATCHLIST = "RELIANCE.IN,TCS.IN,HDFCBANK.IN,INFY.IN,BHARTIARTL.IN"


class NSEStreamClient:

    def __init__(self, api_key: str):
        self.url     = f"wss://data.infoway.io/ws?business=india&apikey={api_key}"
        self.ws: Optional[websockets.WebSocketClientProtocol] = None
        self.running = True
        self._hb_task: Optional[asyncio.Task] = None

    def _tid(self) -> str:
        return str(uuid.uuid4())

    async def _send(self, msg: dict) -> None:
        if self.ws:
            await self.ws.send(json.dumps(msg))

    async def _subscribe(self) -> None:
        # Subscribe to trades
        await self._send({"code": 10000, "trace": self._tid(),
                          "data": {"codes": WATCHLIST}})
        await asyncio.sleep(5)
        # Subscribe to 1-minute candles
        await self._send({"code": 10006, "trace": self._tid(),
                          "data": {"arr": [{"type": 1, "codes": WATCHLIST}]}})
        logger.info("Subscribed to %d symbols", len(WATCHLIST.split(",")))

    def _start_heartbeat(self) -> None:
        if self._hb_task and not self._hb_task.done():
            self._hb_task.cancel()

        async def beat():
            while True:
                await asyncio.sleep(30)
                if not self.ws or self.ws.close_code is not None:
                    break
                await self._send({"code": 10010, "trace": self._tid()})

        self._hb_task = asyncio.create_task(beat())

    def on_trade(self, data: dict) -> None:
        direction = {0: " ", 1: "↑", 2: "↓"}.get(data.get("td"), "?")
        logger.info("TRADE  %-16s  ₹%-10s  vol=%-10s  %s",
                    data.get("s"), data.get("p"), data.get("v"), direction)

    def on_candle(self, data: dict) -> None:
        logger.info("CANDLE %-16s  o=%-8s h=%-8s l=%-8s c=%-8s  vol=%s",
                    data.get("s"), data.get("o"), data.get("h"),
                    data.get("l"), data.get("c"), data.get("v"))

    def dispatch(self, raw: str) -> None:
        try:
            msg = json.loads(raw)
        except json.JSONDecodeError:
            return
        code = msg.get("code")
        data = msg.get("data", {})
        if code == 10002:
            self.on_trade(data)
        elif code == 10008:
            self.on_candle(data)

    async def _run_once(self) -> None:
        async with websockets.connect(self.url) as ws:
            self.ws = ws
            await self._subscribe()
            self._start_heartbeat()
            try:
                async for message in ws:
                    self.dispatch(message)
            finally:
                if self._hb_task:
                    self._hb_task.cancel()
                self.ws = None

    async def start(self) -> None:
        backoff = 5
        while self.running:
            try:
                await self._run_once()
                backoff = 5
            except ConnectionClosed as e:
                logger.warning("Disconnected: %s", e)
            except Exception as e:
                logger.error("Error: %s", e)
            if not self.running:
                break
            await asyncio.sleep(backoff)
backoff = min(backoff * 2, 60)This is a clean baseline. The next section extends it with the one capability that separates an India-market-aware client from a generic streaming client.
Phase 4: Circuit Halt Detection
Circuit breakers are India’s mechanism for slowing a market in panic. Every stock listed on NSE or BSE has a circuit filter assigned by SEBI: either 2%, 5%, 10%, or 20%, the maximum intraday move allowed before trading in that stock is paused. When a stock hits its upper or lower circuit limit, it gets frozen at that price for at least 15 minutes. If the circuit is triggered again after trading resumes, the halt extends for the rest of the session.
From the perspective of your data feed, a circuit halt is invisible, the stream simply stops sending updates for that symbol. No error, no notification, no status flag. The last trade prints at the circuit price, and then nothing…
There are also market-wide index circuit breakers: if the Nifty 50 index itself drops 10% intraday, both NSE and BSE halt all trading for 45 minutes. A 15% drop triggers a 1h45m halt; a 20% drop ends the trading session entirely. When this happens, your WebSocket stream will go silent across every subscribed symbol simultaneously.
The way to detect these scenarios programmatically is to track last-tick timestamps and raise an alert when a symbol that normally trades frequently has gone quiet during an open session.
Here’s an extension to the streaming client that adds this logic:
import asyncio
import json
import uuid
import logging
from datetime import datetime, timezone, timedelta
from typing import Optional
import websockets
from websockets.exceptions import ConnectionClosed

logging.basicConfig(level=logging.INFO,
                    format="%(asctime)s %(levelname)s %(message)s")
logger = logging.getLogger("nse-ws")

IST      = timezone(timedelta(hours=5, minutes=30))
WATCHLIST = "RELIANCE.IN,TCS.IN,HDFCBANK.IN,INFY.IN,BHARTIARTL.IN"
CIRCUIT_ALERT_SECS = 300   # 5 minutes of silence = suspected circuit halt


def market_is_open() -> bool:
    now = datetime.now(IST)
    if now.weekday() >= 5:
        return False
    t = now.time()
    def hm(s): return datetime.strptime(s, "%H:%M").time()
    return hm("09:15") <= t < hm("15:30")


class NSEStreamClientWithCircuitDetection:
    """NSE WebSocket client with circuit halt watchdog."""

    def __init__(self, api_key: str):
        self.url      = f"wss://data.infoway.io/ws?business=india&apikey={api_key}"
        self.ws: Optional[websockets.WebSocketClientProtocol] = None
        self.running  = True
        self._hb_task:  Optional[asyncio.Task] = None
        self._wd_task:  Optional[asyncio.Task] = None

        # Track last-tick time and detected circuit status per symbol
        self._last_tick:    dict[str, float] = {}
        self._in_circuit:   set[str]         = set()

    def _tid(self) -> str:
        return str(uuid.uuid4())

    async def _send(self, msg: dict) -> None:
        if self.ws:
            await self.ws.send(json.dumps(msg))

    async def _subscribe(self) -> None:
        await self._send({"code": 10000, "trace": self._tid(),
                          "data": {"codes": WATCHLIST}})
        await asyncio.sleep(5)
        await self._send({"code": 10006, "trace": self._tid(),
                          "data": {"arr": [{"type": 1, "codes": WATCHLIST}]}})

    def _start_heartbeat(self) -> None:
        if self._hb_task and not self._hb_task.done():
            self._hb_task.cancel()

        async def beat():
            while True:
                await asyncio.sleep(30)
                if not self.ws or self.ws.close_code is not None:
                    break
                await self._send({"code": 10010, "trace": self._tid()})

        self._hb_task = asyncio.create_task(beat())

    def _start_watchdog(self) -> None:
        if self._wd_task and not self._wd_task.done():
            self._wd_task.cancel()

        async def watch():
            while True:
                await asyncio.sleep(60)
                if not market_is_open():
                    continue
                now = asyncio.get_event_loop().time()
                for sym in WATCHLIST.split(","):
                    last = self._last_tick.get(sym)
                    if last is None:
                        continue
                    silence = now - last
                    if silence > CIRCUIT_ALERT_SECS and sym not in self._in_circuit:
                        self._in_circuit.add(sym)
                        logger.warning(
                            "CIRCUIT HALT SUSPECTED  %-16s  "
                            "no tick for %.0f min — last price may be locked",
                            sym, silence / 60
                        )
                    elif silence <= CIRCUIT_ALERT_SECS and sym in self._in_circuit:
                        self._in_circuit.discard(sym)
                        logger.info("CIRCUIT CLEARED  %-16s  ticks resuming", sym)

        self._wd_task = asyncio.create_task(watch())

    def _record_tick(self, sym: str) -> None:
        self._last_tick[sym] = asyncio.get_event_loop().time()

    def dispatch(self, raw: str) -> None:
        try:
            msg = json.loads(raw)
        except json.JSONDecodeError:
            return
        code = msg.get("code")
        data = msg.get("data", {})
        sym  = data.get("s", "")

        if code == 10002:       # trade push
            self._record_tick(sym)
            direction = {0: " ", 1: "↑", 2: "↓"}.get(data.get("td"), "?")
            logger.info("TRADE  %-16s  ₹%-10s  %s", sym, data.get("p"), direction)

        elif code == 10008:     # candle push
            self._record_tick(sym)
            logger.info("CANDLE %-16s  c=%-10s  vol=%s",
                        sym, data.get("c"), data.get("v"))

        elif code in (10001, 10007):
            logger.info("Subscribed (code=%s)", code)

    async def _run_once(self) -> None:
        async with websockets.connect(self.url) as ws:
            self.ws = ws
            logger.info("Connected to NSE stream")
            await self._subscribe()
            self._start_heartbeat()
            self._start_watchdog()
            try:
                async for message in ws:
                    self.dispatch(message)
            finally:
                for task in (self._hb_task, self._wd_task):
                    if task:
                        task.cancel()
                self.ws = None

    async def start(self) -> None:
        backoff = 5
        while self.running:
            try:
                await self._run_once()
                backoff = 5
            except ConnectionClosed as e:
                logger.warning("Disconnected: %s", e)
            except Exception as e:
                logger.error("Error: %s", e)
            if not self.running:
                break
            await asyncio.sleep(backoff)
            backoff = min(backoff * 2, 60)

    def stop(self) -> None:
        self.running = False


async def main():
    client = NSEStreamClientWithCircuitDetection(api_key="YOUR_API_KEY_HERE")
    await client.start()


if __name__ == "__main__":
    try:
        asyncio.run(main())
    except KeyboardInterrupt:
passThe watchdog runs every 60 seconds and checks every subscribed symbol. If a symbol has been silent for 5 minutes during open market hours, it logs a CIRCUIT HALT SUSPECTED warning and adds the symbol to a tracking set. When ticks resume, after the 15-minute halt window, it logs CIRCUIT CLEARED. This gives downstream logic (alert systems, portfolio valuation engines) a clean signal about which stocks are tradeable at any given moment.
A note on market-wide halts: If the Nifty 50 drops 10% intraday and a market-wide circuit breaker fires, your entire watchlist will go silent at once. You can distinguish this from a widespread multi-stock circuit event by checking whether the silence affects ALL your symbols simultaneously, that signature, combined with checking the current time against known halt durations (10% → 45-minute halt), indicates a Nifty-level event rather than stock-specific circuits.
Building Historical Context: Daily Candles and the 52-Week Range
Live data tells you where a stock is. Historical candle data tells you what it means. A stock at ₹1,400 means something very different if it was at ₹900 six months ago vs. ₹2,000.
The Infoway API candle endpoint (POST /india/v2/batch_kline) returns up to 500 bars per request and supports backward pagination via a timestamp anchor. This makes it straightforward to download a full year of daily data for any symbol:
import requests
import json
import time as _time
from datetime import datetime, timezone, timedelta

IST      = timezone(timedelta(hours=5, minutes=30))
ENDPOINT = "https://data.infoway.io/india/v2/batch_kline"
HEADERS  = {
    "User-Agent":   "Mozilla/5.0",
    "Accept":       "application/json",
    "Content-Type": "application/json",
    "apiKey":       "YOUR_API_KEY_HERE"
}


def fetch_daily_bars(symbol: str, count: int,
                     until_ts: int | None = None) -> list[dict]:
    payload = {"klineType": 8, "klineNum": count, "codes": symbol}
    if until_ts:
        payload["timestamp"] = until_ts
    r = requests.post(ENDPOINT, headers=HEADERS, data=json.dumps(payload))
    r.raise_for_status()
    for item in r.json().get("data", []):
        if item["s"] == symbol:
            return item.get("respList", [])
    return []


def load_one_year(symbol: str) -> list[dict]:
    all_bars: list[dict] = []
    cursor: int | None = None
    while True:
        batch = fetch_daily_bars(symbol, count=500, until_ts=cursor)
        if not batch:
            break
        all_bars.extend(batch)

        oldest_ts  = int(batch[-1]["t"])
        one_yr_ago = int((_time.time() - 365 * 86400))
        if oldest_ts < one_yr_ago:
            break           # enough history loaded
        if cursor and oldest_ts >= cursor:
            break
        cursor = oldest_ts
        _time.sleep(0.3)

    # sort ascending
    all_bars.sort(key=lambda b: int(b["t"]))
    return all_bars


def summarize(symbol: str, bars: list[dict]) -> None:
    if not bars:
        print(f"{symbol}: no data")
        return
    closes  = [float(b["c"]) for b in bars]
    high_52 = max(float(b["h"]) for b in bars)
    low_52  = min(float(b["l"]) for b in bars)
    latest  = closes[-1]
    ma20    = sum(closes[-20:]) / min(20, len(closes))
    ma50    = sum(closes[-50:]) / min(50, len(closes))
    pct_from_52h = (latest - high_52) / high_52 * 100

    print(f"\n{symbol}")
    print(f"  Current:        ₹{latest:,.2f}")
    print(f"  52-week high:   ₹{high_52:,.2f}  ({pct_from_52h:+.1f}% from high)")
    print(f"  52-week low:    ₹{low_52:,.2f}")
    print(f"  20-day MA:      ₹{ma20:,.2f}  ({'above' if latest > ma20 else 'below'})")
    print(f"  50-day MA:      ₹{ma50:,.2f}  ({'above' if latest > ma50 else 'below'})")
    print(f"  {len(bars)} trading days loaded")


for sym in ["INFY.IN", "TCS.IN", "WIPRO.IN"]:
    bars = load_one_year(sym)
    summarize(sym, bars)
_time.sleep(0.5)Sample output:
INFY.IN
  Current:        ₹1,589.75
  52-week high:   ₹1,974.20  (-19.5% from high)
  52-week low:    ₹1,361.40
  20-day MA:      ₹1,542.30  (above)
  50-day MA:      ₹1,498.60  (above)
  253 trading days loaded

TCS.IN
  Current:        ₹3,812.00
  52-week high:   ₹4,592.75  (-17.0% from high)
  52-week low:    ₹3,219.50
  20-day MA:      ₹3,744.80  (above)
  50-day MA:      ₹3,681.20  (above)
  253 trading days loaded

WIPRO.IN
  Current:        ₹487.30
  52-week high:   ₹583.40    (-16.5% from high)
  52-week low:    ₹401.25
  20-day MA:      ₹472.10    (above)
  50-day MA:      ₹458.90    (above)
252 trading days loadedIndia’s IT sector (Infosys, TCS, Wipro) is tracked closely by global investors as a proxy for enterprise software spending worldwide. These three names are among the most-requested India equities from developers building international financial applications.
The Edge Cases That Will Catch You Off Guard
Order Book Depth on NSE
The depth endpoint returns the best bid and ask (1 level). For NSE stocks, the spread tends to be tighter than you might expect for an emerging market, large-caps like Reliance and HDFC Bank regularly trade with 1-tick spreads in the middle of the session. The spread widens at the open (9:15 IST) and in the final minutes before 15:30.
import requests

r    = requests.get(
    "https://data.infoway.io/india/batch_depth/HDFCBANK.IN",
    headers={"User-Agent": "Mozilla/5.0", "Accept": "application/json",
             "apiKey": "YOUR_API_KEY_HERE"}
)
book = r.json()["data"][0]

best_ask = book["a"][0][0]   # best ask price
ask_vol  = book["a"][1][0]   # best ask volume
best_bid = book["b"][0][0]   # best bid price
bid_vol  = book["b"][1][0]   # best bid volume

spread = round(float(best_ask) - float(best_bid), 2)
print(f"Ask: ₹{best_ask} ({ask_vol} shares) Bid: ₹{best_bid} ({bid_vol} shares) Spread: ₹{spread}")a[0][0]= best ask pricea[1][0]= best ask volume.b[0][0]= best bid priceb[1][0]= best bid volume
NSE and BSE Symbols: Same .IN, Different Data
For most large-cap stocks, NSE is where price discovery happens, roughly 90% of equity volume. The .IN suffix in our Realtime Indian stock API covers both exchanges, and for dual-listed stocks you receive the primary exchange’s data. If you need to monitor both exchanges separately (for arbitrage or parity tracking), reach out to us about multi-exchange subscription options.
Some smaller-cap and SME-segment stocks are listed exclusively on BSE and will only appear in BSE data feeds. If your screener is supposed to cover all 5,300+ listed Indian companies, you need BSE coverage, not just NSE.
The NSE Holiday Calendar
NSE and BSE observe Indian national holidays plus some exchange-specific ones. Roughly 14–16 trading holidays per year, which is more than most major markets. A scheduler that assumes “any weekday is a trading day” will fire on Republic Day, Diwali, and a dozen other non-trading days. Always check the official NSE holiday list, published each year in advance.
Muhurat Trading: The Market Opens After Dark
On the evening of Diwali, typically between 6:00 PM and 7:15 PM IST, NSE and BSE run a special 75-minute trading session outside of normal hours. This is not a joke or a minor detail: it’s a real, fully active trading session where genuine capital moves. Prices update, circuits can trigger, and order books are live. (More details here)
For a data pipeline with hardcoded “no market after 16:00” logic, this session is completely invisible. If you serve Indian retail investors, Muhurat Trading is an event you cannot miss, retail sentiment during that session is uniquely elevated, and many participants buy symbolically to mark the start of the Hindu financial new year.
The exact timing varies by year based on the lunar calendar. Add it to your calendar as an annual exception to your session-detection logic.
Getting API Access
Authentication uses a single header on every request:
apiKey: YOUR_API_KEY_HERERegister at the Infoway website to get a key, new accounts receive a 7-day free trial automatically, no credit card required. The trial includes REST access with no symbol restrictions, and WebSocket streaming with a 10-symbol limit per connection.
| Plan | WebSocket symbols / connection |
|---|---|
| Free trial | 10 |
| Basic ($99/mo) | 200 |
| Pro ($199/mo) | 800 |
| Enterprise ($399/mo) | 5,000 |
| Full India Feed ($299/mo) | All NSE + BSE symbols |
The Full India Feed plan is dedicated to India market data. Other plans share the symbol quota across all markets.
Frequently Asked Questions
Why does the data feed go completely silent during a circuit halt?
When a stock hits its upper or lower circuit limit, NSE suspends order matching for that stock. No new trades execute, so there’s nothing to stream. The last price in your feed is the circuit price itself. This is not a data delivery failure, it’s the exchange mechanism working as designed. The watchdog pattern in the circuit detection section above is the standard approach to distinguishing circuit silences from connectivity failures.
What’s the difference between a stock-level circuit and a market-wide circuit?
Stock-level circuits: triggered by that stock’s individual price movement reaching its assigned filter band (2%, 5%, 10%, or 20%). Affects only that symbol. Market-wide circuits: triggered by the Nifty 50 index itself dropping 10%, 15%, or 20% intraday. Halts all trading across both NSE and BSE simultaneously. In a market-wide event, every symbol in your stream goes silent at exactly the same time, that’s the distinguishing signature.
How far back does historical minute data go?
Minute-level candle history is available up to 3 years. Daily candles and weekly/monthly/yearly bars have no practical lookback limit, you can access the full listed history of a stock.
What symbol format does the India feed use?
Company ticker followed by .IN, for example, Reliance is RELIANCE.IN, Infosys is INFY.IN, HDFC Bank is HDFCBANK.IN. The ticker matches the NSE symbol code. Download the complete symbol list from the Infoway dashboard after registering, or query it through this endpoint.
Does the feed include Nifty 50 index values?
The feed covers all NSE and BSE equity symbols. Index data (Nifty 50 as a computed value, not a tradeable stock) is available, check the symbol list on the dashboard. For monitoring market-wide circuit breaker proximity, you can track the weighted basket of Nifty 50 constituents directly.
Can I use this for options and futures data?
The India feed currently covers NSE and BSE equity (cash market) data. If you’re building for the derivatives market, Nifty options, BankNifty options, individual stock futures, contact us for the derivatives data feed roadmap.