

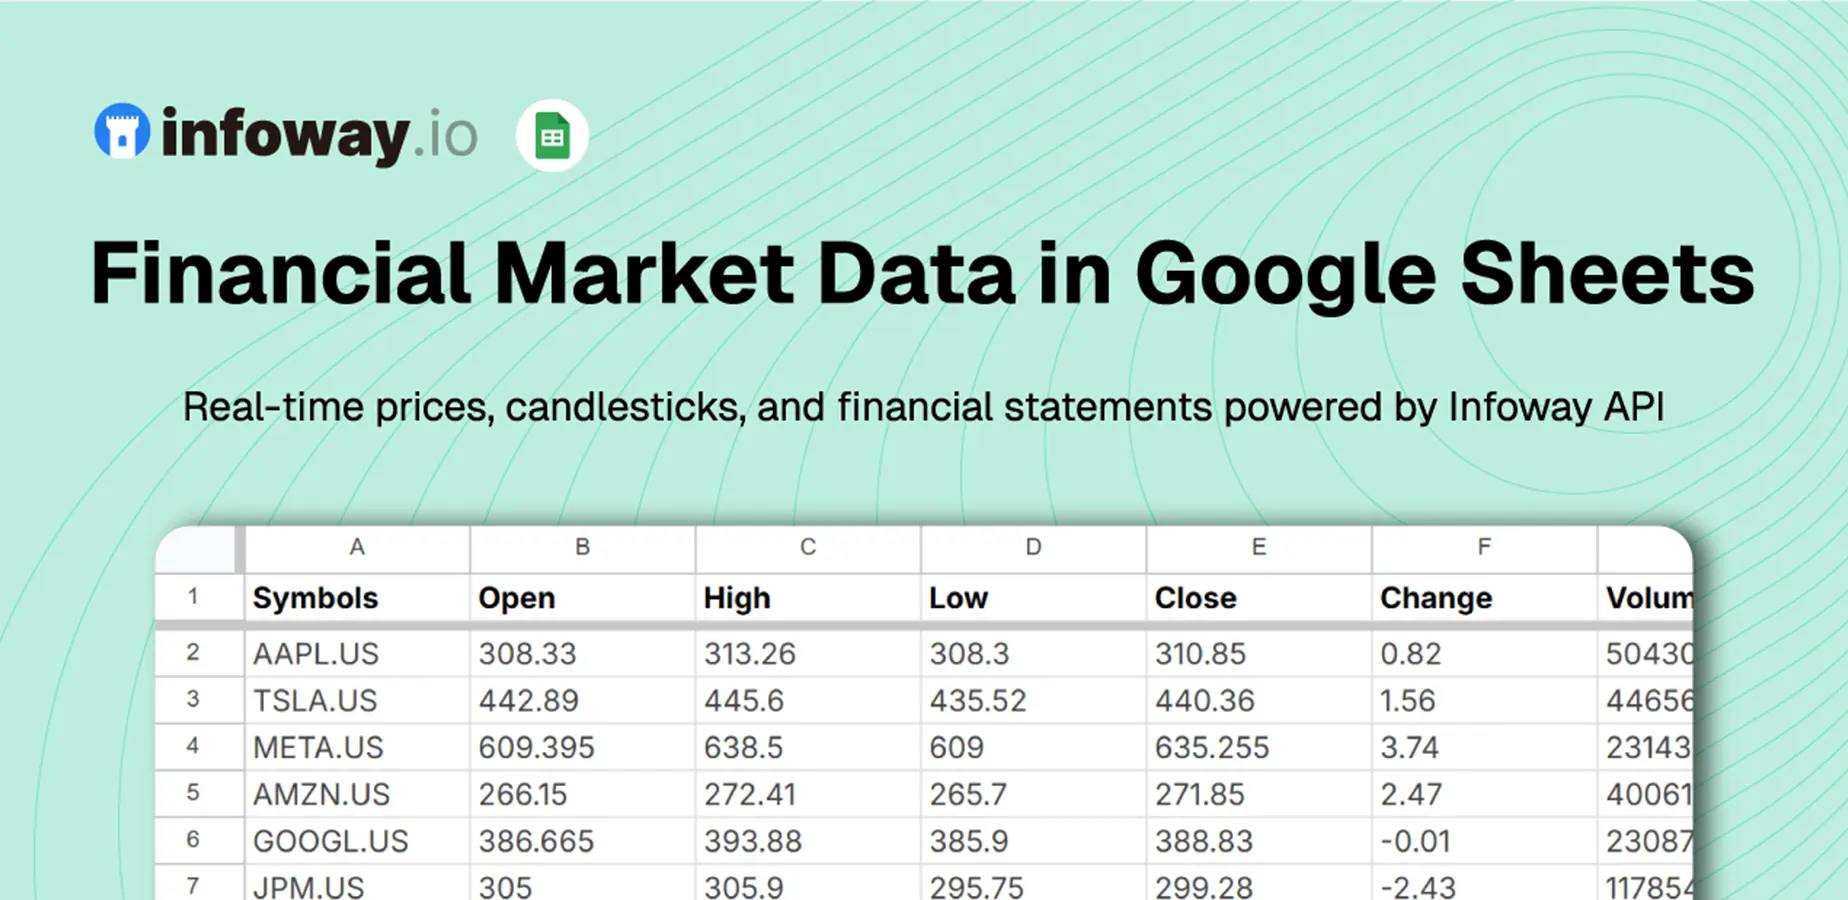
If you’ve ever tried to build a stock watchlist in a spreadsheet, you already know the drill. You reach for =GOOGLEFINANCE("AAPL"), it works for US large caps, and then everything falls apart the moment you need a Hong Kong ticker, an A-share, a Japanese stock, a forex pair, or a P/E ratio that isn’t in Google’s limited field list. Excel users have it worse, there’s no native equivalent, so people paste =WEBSERVICE(...) hacks, install flaky browser plugins, or copy-paste from Yahoo Finance every morning.
This guide is for the analyst, the finance student, the founder tracking a portfolio, and anyone else who wants live-ish market data in a cell without becoming a programmer. We’ll cover two paths:
- Google Sheets stock price API — the easy path. The Infoway API add-on is now live on the Google Workspace Marketplace. Install it, paste an API key, and you get formulas like
=INFOWAY_PRICE("00700.HK")across US, Hong Kong, China, Japan, India, crypto, forex, and commodities. - Stock price API for Excel — a no-code Power Query setup that pulls the same market data from the REST API into a refreshable table, no add-on required.
No Python, no scripts, no cron jobs. Just cells.
Why the Google Finance API and GOOGLEFINANCE Aren’t Enough
First, a myth to clear up: there is no official, public Google Finance API. Google retired the original Google Finance API back in 2012. What survives is the GOOGLEFINANCE spreadsheet function inside Google Sheets — so every search for “google finance api stock price,” “google finance api excel,” or “calling google finance api to get stock prices from excel” is really looking for either that function or a proper replacement. Same story for pulling Yahoo Finance into Excel: there’s no supported Yahoo Finance API either, which is why those =WEBSERVICE() scrapers keep breaking.
GOOGLEFINANCE itself is genuinely useful, and genuinely limited. The gaps that send people looking for something else are always the same:
| Limitation | What it means in practice |
|---|---|
| US-centric coverage | Non-US tickers are hit-or-miss; many Asian and emerging-market symbols simply return #N/A. |
| Thin fundamental data | You get price, volume, and a handful of ratios — no full income statement, cash flow, EPS estimates, or beat/miss data. |
| No control over the source | It’s a black box. When Google changes a symbol mapping or drops an exchange, your sheet breaks and there’s no support channel. |
| Excel has nothing native | Microsoft’s “Stocks” data type is US-focused and can’t be scripted into custom dashboards — there’s no built-in Excel API for stock prices. |
Third-party plugins fill some of this, but they tend to be single-market, break on updates, or lock the useful parts behind a subscription with no free tier to test first. The approach below fixes coverage and fundamentals in one shot, and the Google Sheets path needs zero setup beyond an install and an API key.
Path 1: A Google Sheets Stock Price API with the Infoway Add-on (No Code)
Step 1 — Install the add-on
Open the Marketplace listing and click Install:
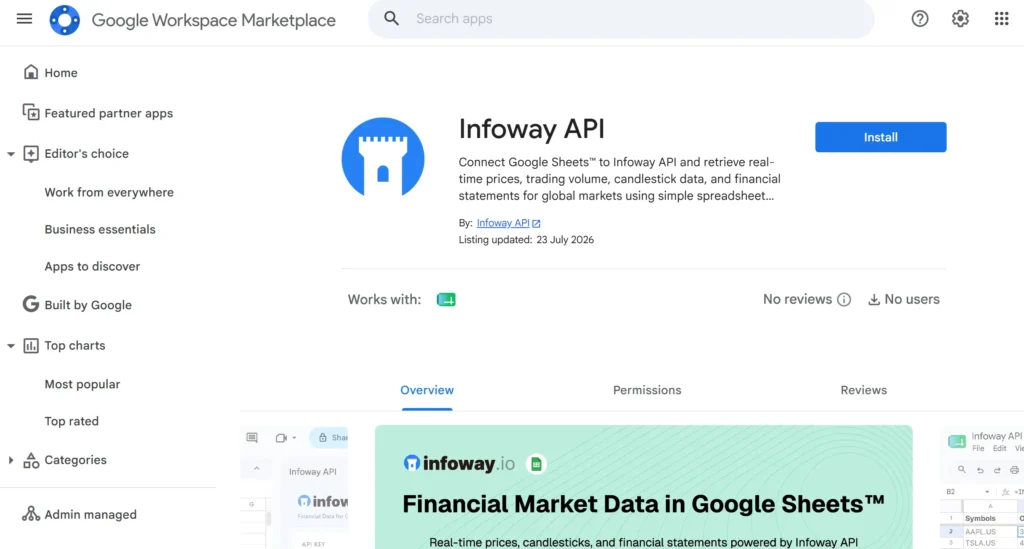
Google will ask for permission to run the add-on inside your spreadsheets.
Once installed, it lives on the sidebar of your Google Sheets:
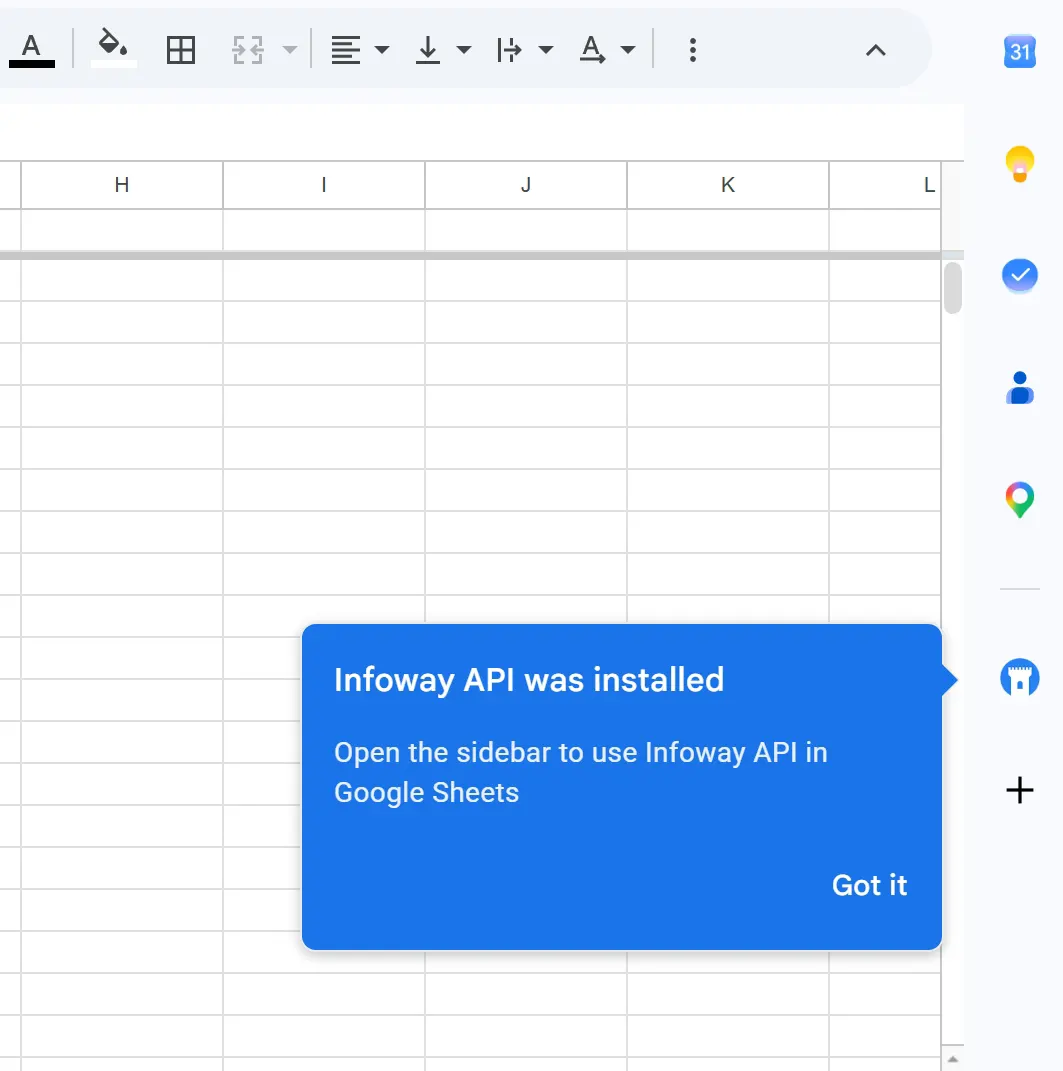
Step 2 — Get a free API key
Every formula needs an API key to return data. Create a free account at https://infoway.io/en/create-account — no credit card required for the trial tier. Copy the key from your dashboard.
Step 3 — Save your key in the sidebar
In your sheet, click the Infoway API icon on the sidebar to open the panel, paste your API key, and save it:
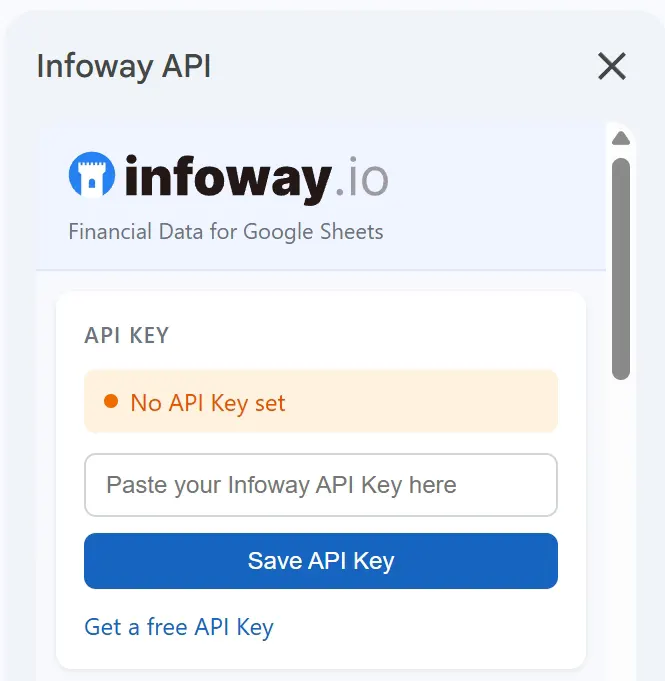
That’s the entire setup. From now on, the custom formulas work in any cell.
Step 4 — Type a formula
=INFOWAY_PRICE("AAPL.US")The cell returns Apple’s latest trade price. Swap the symbol for any market:
=INFOWAY_PRICE("00700.HK")     ← Tencent (Hong Kong)
=INFOWAY_PRICE("600519.SH")    ← Kweichow Moutai (Shanghai A-share)
=INFOWAY_PRICE("7203.JP")      ← Toyota (Japan)
=INFOWAY_PRICE("RELIANCE.IN")  ← Reliance (India)
=INFOWAY_PRICE("BTC/USDT")     ← Bitcoin
=INFOWAY_PRICE("USDCNY")       ← USD/CNY forex
=INFOWAY_PRICE("XAUUSD") ← Gold spot⚠️ Read This First: “Live” Means Snapshot, Not Streaming
This is the single most important thing to understand before you build a dashboard on top of the add-on, and it’s worth being upfront about it.
Google Sheets custom functions do not run on a timer. Google only recalculates a custom formula when one of its arguments changes, or when you open or edit the sheet. That means:
- There is no continuous streaming.
=INFOWAY_PRICE("AAPL.US")shows the price from the moment it last calculated — it will not keep ticking on its own like a trading terminal. - Results are also cached server-side for a short window — roughly 60 seconds for real-time quotes and about 1 hour for financial data — so re-running immediately returns the cached value.
- To force a refresh, trigger a recalculation manually: edit and re-enter the cell, change an argument, delete-and-undo, or simply reopen the sheet.
If you need a genuinely live, minute-by-minute auto-refreshing ticker, a spreadsheet add-on isn’t the right tool today (automatic timed refresh is a planned future feature, but it’s not available yet). For streaming you’d use the WebSocket API in code. But for a watchlist, a portfolio tracker, a valuation screener, or any dashboard you refresh a few times a day, snapshot-on-open is exactly what you want — and it keeps you well within free-tier limits.
The Symbol Format (One Rule to Learn)
Every symbol carries a market suffix (or, for crypto, a slash). Learn this table once and every formula just works:
| Market | Format | Example |
|---|---|---|
| US stock | TICKER.US | AAPL.US |
| Hong Kong stock | CODE.HK | 00700.HK |
| A-share (Shanghai) | CODE.SH | 600519.SH |
| A-share (Shenzhen) | CODE.SZ | 000001.SZ |
| Japan stock | CODE.JP | 7203.JP |
| India stock | SYMBOL.IN | RELIANCE.IN |
| Crypto | BASE/QUOTE | BTC/USDT |
| Forex | PAIR | USDCNY |
| Commodity / metal | SYMBOL | XAUUSD |
| Futures | SYMBOL | CL1! |
Financial-statement and earnings formulas support stocks only (
.US .HK .SH .SZ .JP .IN).
The Formula Cheat Sheet
Here’s everything the add-on exposes, grouped by what you’d use it for.
Real-time quotes (snapshot)
| Formula | Returns | Example |
|---|---|---|
INFOWAY_PRICE | Latest trade price | =INFOWAY_PRICE("AAPL.US") |
INFOWAY_VOLUME | Latest trade volume | =INFOWAY_VOLUME("AAPL.US") |
INFOWAY_TURNOVER | Trade turnover (amount) | =INFOWAY_TURNOVER("AAPL.US") |
Historical candles (OHLCV)
Signature: FUNCTION(symbol, period, n)
period— one of1m 5m 15m 30m 1H 2H 4H 1D 1W 1M 1Q 1Y. Case matters: lowercasem= minutes, uppercaseM= month.n— bar index:1= most recent bar,2= one bar back, and so on (up to500).
| Formula | Returns | Example |
|---|---|---|
INFOWAY_CLOSE | Closing price | =INFOWAY_CLOSE("AAPL.US","1D",1) |
INFOWAY_OPEN | Opening price | =INFOWAY_OPEN("AAPL.US","1D",1) |
INFOWAY_HIGH | High price | =INFOWAY_HIGH("AAPL.US","1D",1) |
INFOWAY_LOW | Low price | =INFOWAY_LOW("AAPL.US","1D",1) |
INFOWAY_KVOLUME | Bar volume | =INFOWAY_KVOLUME("AAPL.US","1D",1) |
INFOWAY_CHANGE | Change % (0.41 = +0.41%) | =INFOWAY_CHANGE("AAPL.US","1D",1) |
INFOWAY_CHANGE_AMT | Absolute price change | =INFOWAY_CHANGE_AMT("AAPL.US","1D",1) |
Want yesterday’s close instead of today’s live bar? Use n = 2: =INFOWAY_CLOSE("AAPL.US","1D",2).
Financial statements — one formula, everything
Signature: INFOWAY_FIN(symbol, category, itemId, periodType, [periodDate])
category—income·cashflow·balance·stats·dividendperiodType—fq(quarterly) ·fy(annual) ·fh(semi-annual, US only)periodDate(optional) — filter to a report date, e.g."2024-12-31"
A few of the most-used item IDs (aliases in parentheses are also accepted):
| Category | itemId | Meaning |
|---|---|---|
income | total_revenue | Total revenue |
income | net_income | Net income |
income | gross_profit | Gross profit |
income | research_and_dev | R&D expense |
cashflow | cash_f_operating_activities (cf_oper) | Operating cash flow |
cashflow | free_cash_flow | Free cash flow |
balance | total_assets | Total assets |
balance | total_debt | Total debt |
stats | price_earnings (pe_ratio) | P/E ratio |
stats | price_book (pb_ratio) | P/B ratio |
stats | return_on_equity (roe) | ROE |
stats | net_margin | Net margin |
dividend | dividend_payout_ratio | Payout ratio |
=INFOWAY_FIN("AAPL.US","income","total_revenue","fq")   ← latest quarterly revenue
=INFOWAY_FIN("AAPL.US","stats","pe_ratio","fq")          ← P/E ratio
=INFOWAY_FIN("00700.HK","stats","roe","fy") ← Tencent annual ROEEarnings / EPS
Signature: FUNCTION(symbol, periodType) where periodType is fq or fy.
| Formula | Returns | Example |
|---|---|---|
INFOWAY_EPS | Actual EPS (most recent) | =INFOWAY_EPS("AAPL.US","fq") |
INFOWAY_EPS_EST | Analyst consensus estimate | =INFOWAY_EPS_EST("AAPL.US","fq") |
INFOWAY_EPS_BEAT | EPS beat % vs estimate (+ = beat) | =INFOWAY_EPS_BEAT("AAPL.US","fq") |
INFOWAY_REV_BEAT | Revenue beat % vs estimate | =INFOWAY_REV_BEAT("AAPL.US","fq") |
Building a Real Dashboard in 5 Minutes
Formulas are more useful together. Here are three ready-to-copy layouts.
1. A multi-market watchlist
Put symbols in column A, then drag these formulas across:
| A (Symbol) | B (Price) | C (Day %) | D (Volume) |
|---|---|---|---|
AAPL.US | =INFOWAY_PRICE(A2) | =INFOWAY_CHANGE(A2,"1D",1) | =INFOWAY_VOLUME(A2) |
00700.HK | =INFOWAY_PRICE(A3) | =INFOWAY_CHANGE(A3,"1D",1) | =INFOWAY_VOLUME(A3) |
7203.JP | =INFOWAY_PRICE(A4) | =INFOWAY_CHANGE(A4,"1D",1) | =INFOWAY_VOLUME(A4) |
BTC/USDT | =INFOWAY_PRICE(A5) | =INFOWAY_CHANGE(A5,"1D",1) | =INFOWAY_VOLUME(A5) |
Because every formula references the symbol in column A, adding a new ticker is just typing it in a new row and dragging the formulas down. Add conditional formatting on column C (green > 0, red < 0) and you have a color-coded board across four markets that no single free tool gives you.
2. A portfolio tracker
| Symbol | Shares | Price | Market Value |
|---|---|---|---|
AAPL.US | 100 | =INFOWAY_PRICE(A2) | =B2*C2 |
600519.SH | 50 | =INFOWAY_PRICE(A3) | =B3*C3 |
Sum column D for a live-on-refresh portfolio total that spans US and A-shares in the same sheet — something GOOGLEFINANCE can’t do.
3. A fundamentals screener
| Symbol | P/E | ROE | Net Margin | Rev Beat % |
|---|---|---|---|---|
AAPL.US | =INFOWAY_FIN(A2,"stats","pe_ratio","fq") | =INFOWAY_FIN(A2,"stats","roe","fq") | =INFOWAY_FIN(A2,"stats","net_margin","fq") | =INFOWAY_REV_BEAT(A2,"fq") |
MSFT.US | =INFOWAY_FIN(A3,"stats","pe_ratio","fq") | =INFOWAY_FIN(A3,"stats","roe","fq") | =INFOWAY_FIN(A3,"stats","net_margin","fq") | =INFOWAY_REV_BEAT(A3,"fq") |
Drop a filter on the header row and you can sort your universe by valuation or profitability without touching a database.
Path 2: A Stock Price API for Excel with Power Query (Also No Code)
The add-on is Google Sheets–only, but Excel users aren’t left out. This is the closest thing to a real Excel API for stock prices: Power Query can pull the same REST endpoint into a refreshable table — no VBA, no macros, just the built-in Get Data tool. It’s also how you get an Excel API for financial statements (income statement, balance sheet, cash flow) that GOOGLEFINANCE and the retired Google Finance API never offered — point the same query at the financial-statement endpoints instead of batch_trade.
Step 1 — Open the Power Query editor
Go to Data ▸ Get Data ▸ From Other Sources ▸ Blank Query, then open Advanced Editor.
Step 2 — Paste a query for live prices
Replace YOUR_API_KEY with your key and list the symbols you want (comma-separated):
let
    Source = Json.Document(
        Web.Contents(
            "https://data.infoway.io/stock/batch_trade/AAPL.US,00700.HK,7203.JP",
            [Headers=[apiKey="YOUR_API_KEY"]]
        )
    ),
    data  = Source[data],
    table = Table.FromRecords(data)
in
tableClick Close & Load and Excel drops a table of live prices onto the sheet. The key fields in each row are s (symbol), p (last price), v (volume), and t (timestamp in Unix milliseconds).
Step 3 — Refresh on demand or on a schedule
Hit Data ▸ Refresh All to pull fresh prices, or set an automatic interval under Query ▸ Properties ▸ Refresh every N minutes. Unlike Google Sheets custom functions, Power Query can refresh on a timer — so if you specifically want Excel to re-pull every few minutes, this is the way to do it. Just keep the interval sensible so you stay inside your plan’s request limits.
For historical bars in Excel, point the query at the candlestick endpoint instead. The batch-trade endpoint above is the direct, no-frills route to “live price in a cell,” which is what most Excel dashboards actually need.
FAQ
Is there really a free tier?
Yes. A free Infoway account (no credit card) gives you an API key at the Free rate limit — plenty for a personal watchlist or portfolio that refreshes a handful of times a day. You can validate the whole workflow before deciding whether you need a paid plan.
Why doesn’t my INFOWAY_PRICE cell update by itself?
Because Google Sheets custom functions recalculate only on argument change or sheet open/edit — not on a timer. This is a Google platform behavior, not an add-on bug. Reopen the sheet, or edit and re-enter the cell, to force a fresh value. See the warning section above for the full explanation.
How current is the “real-time” price?
The quote reflects the latest trade at the moment the formula last calculated, and the server caches it for about 60 seconds. So a freshly refreshed cell is at most ~1 minute behind the tape — fine for monitoring, not intended for high-frequency trading.
Which markets are covered?
US, Hong Kong, mainland China (Shanghai + Shenzhen A-shares), Japan, India, crypto, forex, and commodities/metals — all from the same key and the same formulas. Financial-statement and earnings formulas cover stocks only (.US .HK .SH .SZ .JP .IN).
Can I get full financial statements, not just price?
Yes — that’s the big advantage over GOOGLEFINANCE. INFOWAY_FIN returns income statement, cash flow, balance sheet, valuation ratios, and dividend metrics, and the INFOWAY_EPS* family returns actual vs. estimated EPS with beat/miss percentages.
Do I need to know how to code?
No. The Google Sheets path is pure formulas. The Excel path is Power Query with one query you copy-paste and edit two values in. Neither requires a programming language, a local environment, or a server.
Is there an official Google Finance API I can call?
No — Google retired its public Google Finance API in 2012, and the GOOGLEFINANCE function only works inside Google Sheets (you can’t call it from Excel, Python, or your own app). If you searched for a “google finance api stock price” or “google finance api for indian stock market,” the Infoway add-on (in Sheets) or the REST API (everywhere else) is the supported replacement, with far wider market and fundamental coverage.
Can I pull Yahoo Finance data into Excel instead?
Yahoo Finance has no supported public API either, so “calling Yahoo Finance API to get stock prices from Excel” relies on unofficial scrapers that break often. The Power Query setup in Path 2 is a stable, documented Excel stock price API you can build a dashboard on without worrying about it silently failing.
Does this work for forex in Excel or Google Sheets?
Yes. Forex pairs use the plain-pair format (USDCNY, EURUSD) — =INFOWAY_PRICE("EURUSD") in Sheets, or list the pair in the Power Query URL for Excel. It’s a drop-in for the “google sheets finance forex api” and “free forex api excel” use cases.
What if I need genuine streaming / auto-refresh?
For continuously updating prices, use the WebSocket API from code (Python, JavaScript, etc.) — that’s the tool built for live streams. Automatic timed refresh inside the Sheets add-on is on the roadmap but not available today. In Excel, Power Query’s scheduled refresh is a reasonable middle ground.
Get Started
- Install the add-on: https://workspace.google.com/marketplace/app/infoway_api/606319959160
- Get a free API key: https://infoway.io/en/create-account
- Click the blue Infoway API icon on the sidebar to open the panel, save your key, and type
=INFOWAY_PRICE("AAPL.US").
Full formula reference and API docs: https://docs.infoway.io/en-docs